<br />
<br />
In BIRT versions prior to 4.3, a dynamic Javascript loader (
http://developer.actuate.com/community/devshare/_/designing-birt-reports/1576-dynamic-javascript-loader) needed to be used to load external Javascript files.<br />
<br />
BIRT 4.3 and iHub3 introduced the use of head.js to allow for easy inclusion of JavaScript libraries.<br />
<br />
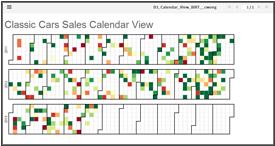
This example demonstrates the ability to visual a D3 Calendar View (based on the
http://bl.ocks.org/mbostock/4063318 example) in a BIRT report, using Classic Cars as a sample data source.<br />
<br />
The total orders amount were summed for each day of the year. Quantiles from $0 to $50,000 were used to segment the total order amounts. When hovering over dates with values, the formatted amounts are displayed in the tool tip for the associated date.<br />
<br />
Notes:<br />
1. For this sample only, internet connection is required to load the JavaScript and CSS files. Files can be moved to a local app/web server, and referenced in head.js accordingly.<br />
2. Configure Eclipse to use an external browser instead of the internal browser to view contents.<br />
3. The report design contains a table with
Display: No Display that populates the client side values for the dates and values.
