BIRT-Adapt dataset on the Value&Category series

Hi everyone,
I'm working on a report where I must modify my data in order to be displayed in a certain way on chart.
in the following report i have a chart that has dynamic Min/Max value (retrieved from the table).
I have additionally added a dynamic step value as the task requires. The chart displays on the x-axis the data row["value"]. Under this data element there are many values (up to four and can be more for different data). the y-axis displays a value which is not of interest.
What i'm trying to do is:
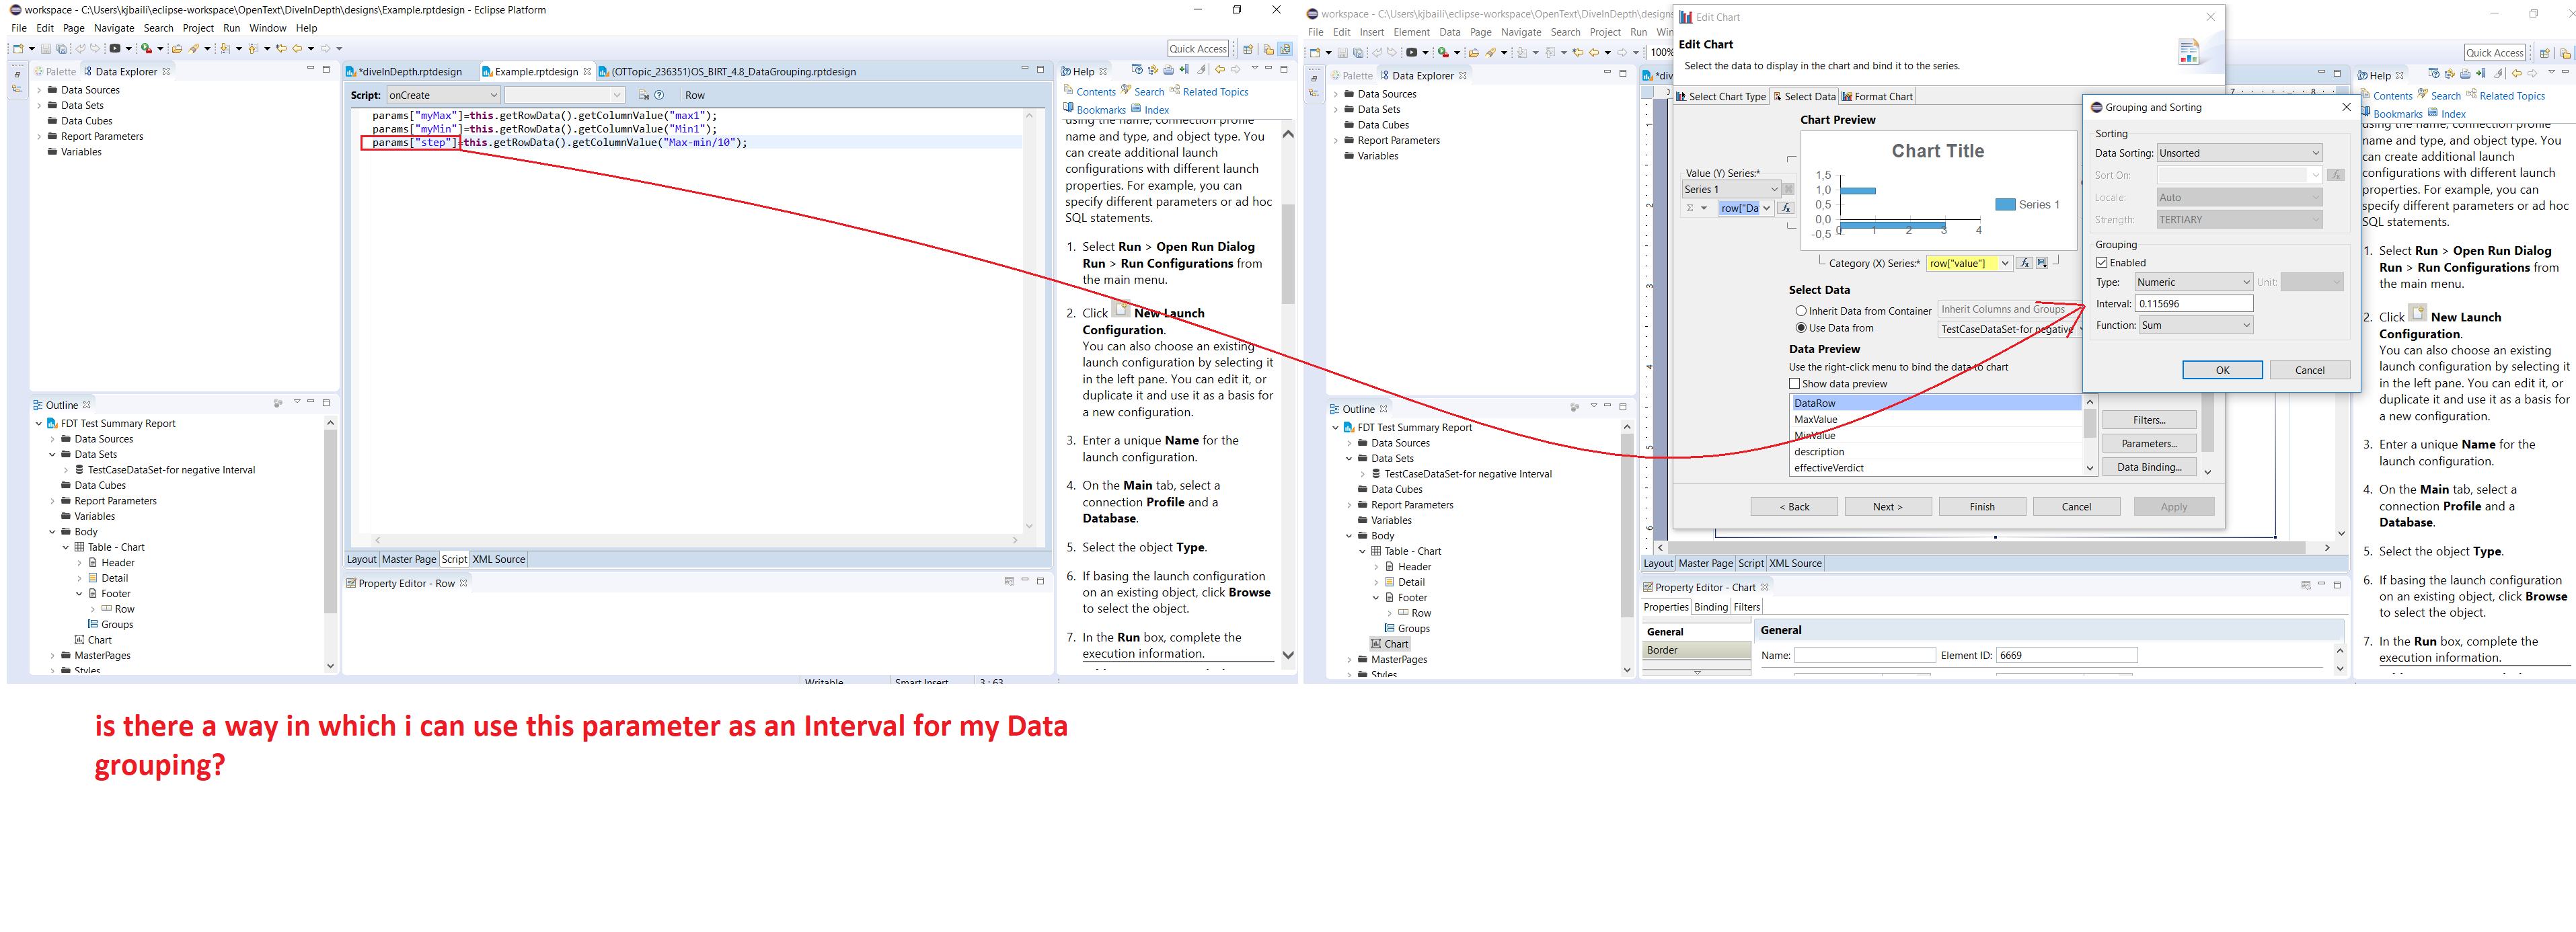
I'm trying to make chart display on the y-axis -->how many values from row["value"] exist in each Interval or step (Note: the step is set dynamically using chart script). To understand this better please see the following pic:
I believe this can be done but this is honestly out of my experience. I think i should start from BeforeDrawSeries event function but don't now how.
I have found a basic chart API where i can probably modify the x-category and Value-y but still the question is how and where i should prepare the data in order to be able to display them as shown above.
https://jmini.developpez.com/eclipse_birt/charting_engine/gallery/curve_fitting_bar/
I've posted therefore a draft example in order to make it easier.
Note that I'm using xml-data source as the task requires. Please view the report using HTML to avoid happening an unknown error.
**I would be really thankful if you could share your thoughts or have solution to this **
thanks in advance
Comments
-
This is how I would accomplish this
 Warning No formatter is installed for the format ipb1
 -
Hi Matthew,
it finally works, you're really my angel . Thank you so much.
There is still one thing left. As you see setting the Interval in chart wizard will be fixed. So i wonder whether i can also set a dynamic Interval(through script for example) that takes it's value from the data element step that is stored in a parameter named (params["step"].
Thanks a lot in advance
0 -
This is going to be more complex due to the order of operations required to accomplish the task.
To my knowledge you cant adjust the grouping/interval of a chart during the report factory (if someone figures out how, please post a solution).
So this must be done in the 'beforeFactory' method of the report.
However, you are wanting this to be a dynamic value based on a returned result set.
So to get the data value, you must run the factory, but by that time, its too late to set the charts grouping/interval.To work around this, we must pre-query the data set before the factory.
As the OpenText forums are very character limiting, I am unable to paste my code example on this post.
Please see my custom solution to run a data set in the 'beforeFactory' code of the attached example, for reference.
This code is not supported and is very complex, so it might break in future/past versions (please use with caution).A quick explanation of the code:
In the first chunk, we execute the 'QueryDataSet()' function with the name of the data set to run and return the value needed (the step interval value).
Then we call in the report chart element (named 'ExampleChart'), access its category grouping object, and set the grouping to true along with the group interval value we retrieved with the QueryDataSet function.
This is all the code needed to set the chart values.In the second chunk (ResultLogic() function), is the logic used to find the value in the result set and return the value.
The third chunk (QueryDataSet() function), is the DEAPI code used to actually call and run the data set information.
This chunk of code should not need modifying unless the DEAPI calls are no longer valid in the version of BIRT you are running.Good luck
Warning No formatter is installed for the format ipb1 -
Hi Mathew,
It works, fantastic. Thank you so much. Now i got one little problem which is setting the Bar-width to be same as my step size that i've used it before as dynamic step size for the x-axis. I found sth like setSeriesthickness() method but don't know where i should use it.
Please see the following picture to understand what I'm trying to do:
I have posted a separate discussion for that but i thought it good to post it here as well since you know everything about it.
Thanks in advance
Khaled
Student-trainee0

Categories
- All Categories
- 108 Developer Announcements
- 53 Articles
- 106 General Questions
- 144 IM Services
- 43 OpenText Hackathon
- 32 Developer Tools
- 20.6K Analytics
- 4.1K AppWorks
- 8.9K Extended ECM
- 899 Cloud Fax and Notifications
- 77 Digital Asset Management
- 9.3K Documentum
- 29 eDOCS
- 120 Exstream
- 39.8K TeamSite
- 1.7K Web Experience Management
